Jesse Lynch, CFA and Tyler Racca
Principal/Sr. Director, Research and Principal/Sr. Research Associate
The One Big Beautiful Bill Act (OBBBA) significantly accelerates the phase-out of longstanding solar and wind energy tax credits, while preserving most credits for other clean power technologies and storage projects. While a healthy debate on when subsidies should or should not be sunsetted continues, we believe the industry will adapt and grow in the face of a potential adjustment period and near-term headwinds.
Alongside natural gas, renewable natural gas, nuclear, geothermal, and hydro, solar and wind are poised to play a growing role in meeting already surging power demand—which has been supercharged by AI. On an unsubsidized basis, solar and wind combined with battery storage and natural gas peaking plants (which fill in when intermittent renewables are offline) are a low-cost and fast way to add electrons to an already stressed power grid.
In this note, we explore key changes to policy and credits from the OBBBA and their potential impacts.
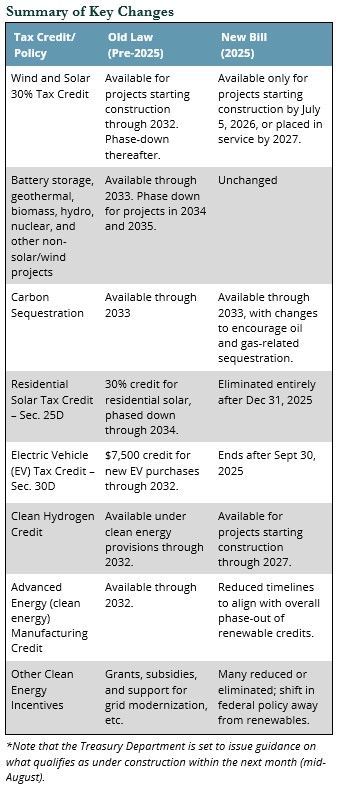
Notable Changes With the OBBBA
The OBBBA shortens the phaseout timeline for solar and wind tax credits. The Inflation Reduction Act (IRA) had granted a gradual wind-down of the credits beginning in 2033. Under the OBBBA, wind and solar projects must begin construction by July 4, 2026, or be placed in service by the end of 2027 to claim these credits. Credits for clean hydrogen and some clean energy manufacturing investments follow a similar accelerated sunsetting timeline.
In addition to credits, other clean energy incentives, including grants, other subsidies, and support for grid modernization and energy storage have been reduced or eliminated. All credits are also now subject to various domestic content and ownership rules.
What Didn’t Change?
Battery storage, geothermal, biomass, renewable gas, hydroelectric, nuclear, and other non-solar and non-wind projects will continue to have until the end of 2033 to start construction to qualify for technology-neutral tax credits at the full rate. The tax credit amounts phase down for the construction of such projects starting in 2034 and 2035.
The preservation of battery storage credits is significant, as this is still a maturing and important sub-sector in the energy transition space, and credits provide support for continued rapid scaling. The preservation of nuclear credits accelerates momentum for new large-scale reactors, as well as small modular reactors. Both storage and nuclear technologies (as well as natural gas plants) provide on-demand sources of power that balance growth in intermittent renewable power.
Near-Term Headwinds
The final version of the OBBBA provides runway for the solar and wind sectors to adjust to life without credit support.
An adjustment period is likely and may impact growth in the near term. There may be increased development activity to meet newly established deadlines, while developers with stretched balance sheets and unwilling sponsors seeking liquidity may create opportunities for well-funded groups to buy high-quality assets at discounted prices.
Tax credit equity, which can be inefficient due to fees, compliance costs, and complexity, will need to be replaced with debt and equity financing. The market will likely need a period to recalibrate prices and fill the 30% gap in financing that tax equity typically provides. This could create a gap in the pipeline of development of new projects beyond those that are delivered with tax credits in 2026 and 2027.
Shifting tariffs on non-U.S. components and materials could also, at least temporarily, increase costs or delay some projects. While there is the potential for additional policy or regulatory shifts discouraging certain types of solar and wind, which is notably out of favor with the current administration, the OBBBA has already established the phaseout for most subsidies, so there is little left to cut as it relates to these sub-sectors.
Solar and Wind Unsubsidized
On an unsubsidized basis, solar (distributed, utility scale) and wind plus storage/gas peaking plants are competitive with thermal and nuclear plants. The option to add renewables vs. thermal power in any specific circumstance depends on project-specific factors, including interconnection, nearby transmission, pipelines, timeline, and availability of resources. The economics of each are also generally regionally dependent, with solar resources most abundant in the southwest and west, wind most abundant in the central plains, and natural gas most abundant in TX, NM, LA, PA, and various locales where infrastructure is robust.
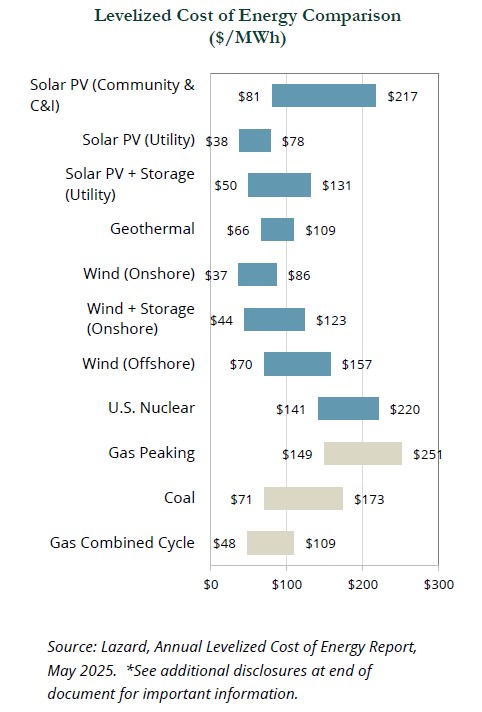
Solar and wind (to a lesser extent) are currently advantaged in many cases, as lead times for new combined cycle gas plants can be three to five years plus due to backlogs for turbines and permitting. By contrast, solar and wind are modular and can be brought online relatively quickly, assuming interconnections are secured. Solar has grown rapidly in recent years, with solar and battery storage accounting for 84% of all new electric generating capacity added to the grid in 2024 according to the U.S. Energy Information Administration (EIA).
Market Adjustment?
Historically, when input costs increase or another event disrupts the market, prices for offtake agreements or power purchase agreements (PPAs) have responded in relatively short order. For example, as a result of COVID supply chain issues and rising demand, PPA prices increased rapidly in 2020: solar PPA increased 11.7% and wind PPA prices increased 24.3% according to Utility Dive.
Higher power prices would mean more attractive margins for solar and wind, incentivizing developers to add supply. Higher margins would also support additional debt and equity financing needed to replace the gap in tax equity financing. As capacity is added and the industry adjusts to life without tax credits (which are not always efficient), costs, and therefore power prices, may decline.
Tailwinds
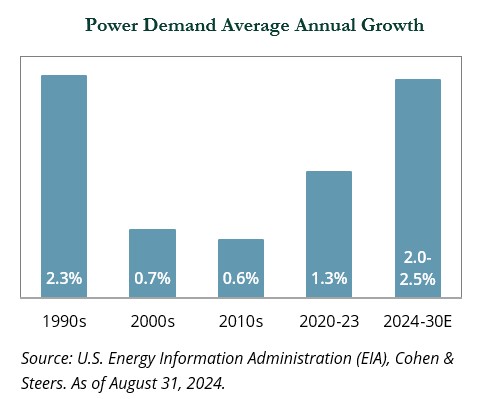
Elevated load growth is likely to continue beyond the end of the decade, driven by the electrification of industry, fleets, the military, technological advances, data consumption, AI, and population and economic growth. Demand appears likely to outstrip supply. In 2024, power demand grew by 2.0%, according to the EIA, and meeting this growth required a herculean effort by the power industry.
With demand so strong, the power industry will need to deploy all competitive technologies and renewables are expected to continue to be a growing and important part of the solution.
State and Corporate Support
Federal policy has shifted meaningfully, but state-level renewable standards and policy support appear largely intact, and some states and cities may look to compensate for diminished federal credits. Corporates, including hyperscalers such as Amazon, Google, and Meta, whose data centers are driving significant growth in power demand, appear committed to powering their plants with low-carbon energy, including a combination of renewables, peaking plants, battery storage, and combined cycle natural gas plants (50% less emissions vs. coal).
Industry Leaders Weigh In
Some industry leaders believe that sunsetting longstanding solar and wind tax credits is a positive for the health of the maturing industry and will eliminate inefficiencies, optimize capital deployment, and allow the sector to shed its partisan reputation.
“Today, renewables and battery storage are the lowest-cost form of power generation and capacity, and we can build these projects and get new electrons on the grid in 12 to 18 months.” – John Ketchum, Chief Executive of renewable energy developer NextEra Energy. Financial Times, June 12, 2025.
“The Big Tech companies have global businesses, they have operations in Japan and Europe, places where decarbonization is important … They take long-term views so this administration is just a blip on a 30-year megatrend that they’re focused on.” – Henry Makansi, Managing partner at Kimmeridge. Financial Times, June 12, 2025.
Potential Opportunities
Many private infrastructure-backed companies and projects appear positioned to meet tax credit requirements before the phase out, including domestic content and ownership.
However, the phase out of credits may create pain for some projects and firms that underwrote rapid near-term growth into their business plans or are unable to meet the 2026 and 2027 deadlines for construction, placed in service status, and domestic content requirements. This dynamic is producing opportunities for well-funded groups to acquire assets at attractive prices. Power, decarbonization, and energy transition tailwinds should, in our view, continue to create attractive investment opportunities over the coming years.
Private infrastructure specialists, as well as diversified value-add infrastructure strategies that invest in decarbonization and energy transition, have a wide opportunity set and look to nimbly invest in high-quality projects and management teams. While solar and wind are part of the opportunity set, managers typically can invest in a wide array of subsectors, including utility scale and distributed assets across battery storage, hydro, pumped hydro, gas peaking plants, base load gas power plants (50% cleaner than coal), small modular nuclear reactors, resource efficiency infrastructure, water, waste water, solid waste, renewable natural gas, carbon capture, industrial decarbonization, and more.
On the public side, clean energy indices and strategies are typically less allocated to infrastructure, instead having significant exposure to suppliers, technology companies, and foreign holdings. These exposures were severely impacted by the rapid rise in rates beginning in 2022 and traded sharply lower into 2024. With the benefit of lower valuations and strengthening tailwinds, clean energy indices have moved higher through the first half of 2025, both before and after the signing of the OBBBA. Year-to-date through July 22, 2025, the S&P Global Clean Energy Index was up 22.2%.
Transition tailwinds will also continue to attract capital and talent. The combination should spur further innovation and create a wide range of investment opportunities across public equity, credit, venture capital, and private equity, including innovative service and technology companies such as AI-enabled grid management solutions.
Conclusion
With the OBBBA in effect, the phaseout timeframe of long-standing tax credits for solar and wind has been 90% resolved. Near-term headwinds, along with an adjustment period, are expected, but solar in its various forms (including utility scale, behind-the-meter, community solar, and wind power) is expected to continue to play an important role in decarbonizing the grid and meeting rapidly rising demand.
Bloomberg Index Services Limited. BLOOMBERG® is a trademark and service mark of Bloomberg Finance L.P. and its affiliates (collectively “Bloomberg”). Bloomberg or Bloomberg’s licensors own all proprietary rights in the Bloomberg Indices. Bloomberg does not approve or endorse this material, or guarantee the accuracy or completeness of any information herein, or make any warranty, express or implied, as to the results to be obtained therefrom and, to the maximum extent allowed by law, it shall not have any liability or responsibility for injury or damages arising in connection therewith. Copyright ©2025, S&P Global Market Intelligence (and its affiliates, as applicable) Indices referenced are unmanaged and cannot be invested in directly. Index returns do not reflect any investment management fees or transaction expenses. All commentary contained within is the opinion of Prime Buchholz and is intended for informational purposes only; it does not constitute an offer, nor does it invite anyone to make an offer, to buy or sell securities. The content of this report is current as of the date indicated and is subject to change without notice. It does not take into account the specific investment objectives, financial situations, or needs of individual or institutional investors. Some statements in this report that are not historical facts are forward-looking statements based on current expectations of future events and are subject to risks and uncertainties that could cause actual results to differ materially from those expressed or implied by such statements. Information obtained from third-party sources is believed to be reliable; however, the accuracy of the data is not guaranteed and may not have been independently verified. Performance returns are provided by third-party data sources. Past performance is not an indication of future results. *Source: Lazard estimates and publicly available information. Note: Here and throughout this analysis, unless otherwise indicated, the analysis assumes 60% debt at an 8% interest rate and 40% equity at a 12% cost. See page titled “Levelized Cost of Energy Comparison—Sensitivity to Cost of Capital” for cost of capital sensitivities. Solar PV + Storage (Utility) and Wind + Storage (Onshore): Reflects the LCOE for a system composed of standalone generation plus standalone storage less the combined system-level synergies (assumed to be 10% of storage capital costs and 25% of inverter costs). The synergies capture potential cost reductions or efficiency gains from integrating generation and storage, such as shared interconnection infrastructure, improved energy dispatch, enhanced capacity utilization and operational efficiencies. Coal, U.S. Nuclear, Geothermal: Given the limited public and/or observable data available for new-build geothermal, coal and nuclear projects, the LCOE presented herein reflects Lazard’s LCOE v14.0 results adjusted for inflation and, for nuclear, are based on then-estimated costs of the Vogtle Plant. Coal LCOE does not include cost of transportation and storage. Conventional Generation (Gas Peaking, U.S. Nuclear, Coal, Gas Combined Cycle): The fuel cost assumptions for Lazard’s LCOE analysis of gas-fired generation, coal-fired generation and nuclear generation resources are $3.45/MMBTU, $1.47/MMBTU and $0.85/MMBTU, respectively, for year-over-year comparison purposes. © 2025 Prime Buchholz LLC