Overview
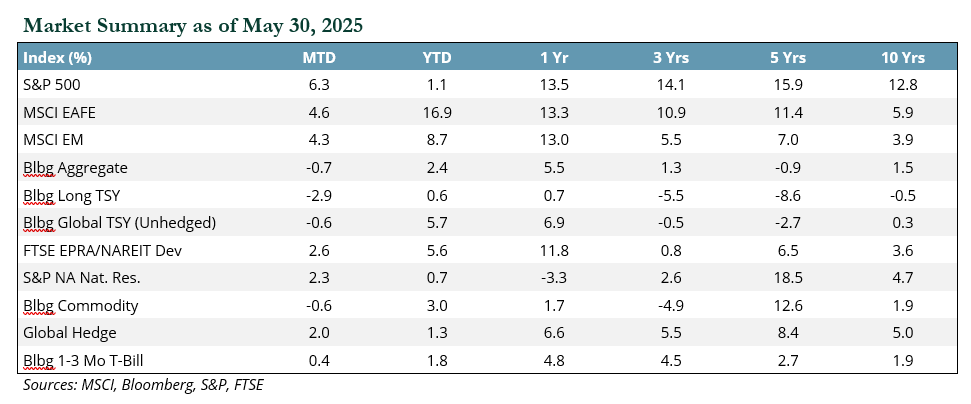
Equity markets rebounded strongly in May, led by large cap U.S. stocks and the resurgence of the “Magnificent 7,” particularly NVIDIA and Tesla. Growth stocks outperformed value, led by the technology and communications sectors. International markets also rose, with Europe recovering after temporary tariff threats from the U.S., and Japan benefiting from increased foreign investment. Emerging markets gained modestly, driven by policy support in China and strong performance in Taiwan.
Fixed income returns were mixed as the Federal Reserve held rates steady but expressed concerns about inflation and unemployment. The proposed U.S. tax and spending bill raised deficit fears, pushing Treasury yields higher and causing losses in long-dated government bonds. Credit markets saw wider spreads but modest gains in securitized sectors.
Hedge funds gained in May, led by long/short equity and event-driven strategies. Systematic macro strategies lagged. Equity rallies and increased deal activity supported performance, reversing prior months’ outflows and volatility.
Real assets underperformed broader equities but saw positive returns. Global REITs benefited from rate cuts abroad, while clean energy and infrastructure gained on energy security concerns. Commodities posted mixed results, with oil and gas prices rising on geopolitical tensions and demand, while agricultural and precious metals declined.
Equities
Domestic equity markets rebounded in May following three consecutive down months, as investors shrugged off concerns about the tariff impact. Both the S&P 500 and the broader Russell 3000 Index gained 6.3%. The Magnificent 7 stocks returned to market leadership, with NVIDIA (+24.1%) and Tesla (+22.8%) posting the largest gains.
Large and mid cap stocks outpaced small caps, with the Russell 1000 Index advancing 6.4% versus 5.3% for the Russell 2000 Index. After getting off to a strong start in the first quarter of the year, value stocks lagged their growth counterparts for the second consecutive month; the Russell 3000 Value Index returned 3.5% vs. 8.7% for the Russell 3000 Growth Index.
Strong gains from the Magnificent 7 stocks lifted their respective sectors. IT (+10.9%) was the best performing sector for the month, followed closely by communications services (+9.8%) and consumer discretionary (+9.5%). The only sector to finish May in the red was healthcare (−4.8%), with blue chips Eli Lilly (−18.8%) and UnitedHealth Group (−26.6%) accounting for much of the drawdown. Eli Lilly came under pressure due to increased competition within its flagship weight loss franchise, while UnitedHealth withdrew guidance following a CEO change.
International equity remained strong despite ongoing uncertainty surrounding global trade, with the MSCI EAFE rising 4.6% for the month. President Trump’s threat of 50% tariffs on imports from the European Union on May 23 slowed the region’s rally. However, Trump backed off this stance just days later, leading European equities to recover their losses and close May up 4.6%.
Germany (+5.7%) and Italy (+7.6%) remained standouts, with both countries up over 30% in USD terms year-to-date (YTD) through the end of May. Japan (+4.1%), which had lagged other major non-U.S. markets, staged a recovery, benefiting from an increase in foreign investor flows.
The MSCI Emerging Markets Index rose 4.3% for the month. China (+2.7%) was supported by a combination of domestic policy response and de-escalation in trade tension. Markets lifted when U.S. and Chinese officials announced a temporary trade deal on May 12. The deal resulted in a 90-day pause on reciprocal tariffs and presumably paved the way for further negotiations, although progress was short lived. Tensions rose once again at month-end after each side accused the other of violating the trade agreement.
With all reciprocal tariffs now on hold, other major emerging markets were driven primarily by idiosyncratic factors. Taiwan (+12.5%) was a standout performer. Its largest benchmark constituent, Taiwan Semiconductor, rose 13.7% following strong earnings results in the face of trade uncertainty and projections for continued demand. Brazil (+0.05%) lagged on continued fiscal concerns.
Fixed Income
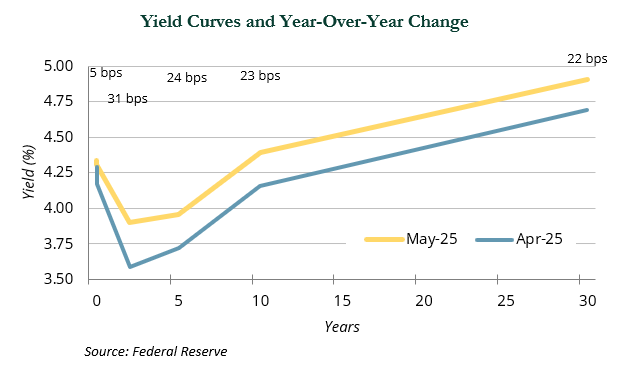
The Federal Reserve met on May 7 and made no changes to monetary policy. The statement released after the conclusion of the meeting indicated that the FOMC sees higher uncertainty about the economic outlook and “judges that the risks of higher unemployment and higher inflation have risen.” Fed Chair Jerome Powell emphasized that he believes policy is in a good place and that the Fed can be patient as it assesses how government policies impact its dual mandate. Markets started to pull back on expectations for two rate cuts in 2025, given resilience in the non-survey-based macro data.
Later in May, the House passed the “One Big Beautiful Bill Act,” a tax package focused on tax breaks, spending cuts, border security, and other provisions. In accordance with Congressional procedure, the bill has been sent to the Senate, where it awaits approval following deliberation. Markets pushed rates higher in the following days, signaling concern about the bill’s potential impact on the federal deficit. As a result, Treasury strategies largely delivered negative returns, outside of the +0.4% return of Treasury bills. Long Treasuries fell 2.9% in May and lagged the −1.0% return for Treasuries maturing in the next 5-10 years and the −0.2% return for short-term Treasuries (those maturing over the next 1-3 years).
As a result of the changes in the shape of the curve, intermediate-term Treasuries, those that mature in the next 5-10 years, rose 1.2% and outperformed both the +0.8% return of short-term Treasuries and the +0.4% in the 3-month T-bill.
Credit markets saw wider spreads across all areas of fixed income, with a 37 bps increase in high yield spreads, a 12 bps rise in investment-grade corporates, and a 7 bps, 9 bps, and 15 bps increase in MBS, CMBS, and ABS, respectively. High yield offers extra carry and delivered a flat return, while investment-grade fell during the month (−3 bps). Securitized assets delivered positive returns despite wider spreads, with a 0.9% gain in CMBS, a +0.5% rise in ABS, and a +0.3% increase in MBS.
Flexible Capital
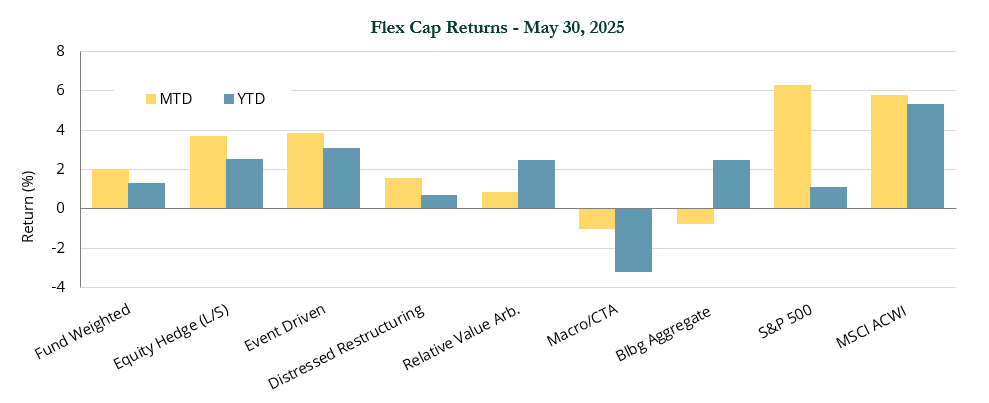
Despite trailing broad markets during the month, May was a good month for hedge funds on an absolute basis, with the hedge fund composite (HFRI Fund Weighted Composite Index) returning +2.0% for the month. The composite index is up 1.3% YTD, keeping hedge funds slightly ahead of the S&P 500 through the first five months of the year. Prime brokers reported global equities were net bought during the month for the first time this year, resulting in the largest one-month net buying in years. This was reportedly led by single stock long purchases and short covering across a lot of macro products. This activity comes after March and April exhibited record outflows in a number of market areas.
The vast majority of hedge fund strategies were positive during the month and fundamental long/short equity outperformed most other strategies. The HFRI Equity Hedge Index was up 3.7% in May. Gains in long/short equity were primarily driven by beta exposure on the back of a strong rally in equity markets. The largest long alpha generally came from exposure to technology and growth-oriented sectors, while short exposure generally offset long gains. More directional equity managers outperformed those with lower net exposure during the month.
Event-driven managers also did well in May, as deal activity and corporate event announcements increased in the U.S. and Europe. The HFRI Event Driven Index gained 3.8% for the month. Certain credit-related positions experienced recoveries from April pullbacks, rewarding credit managers that were buyers in April.
Systematic trading was the only negative major hedge fund strategy in May, as the HFRI Macro Index lost 1.0% for the month. This pattern is mirrored YTD, with the HFRI Macro Index (−3.3%) as the only negative hedge fund strategy through the first five months of the year. Systematic macro strategies remain challenged, as markets have not exhibited clear trends in 2025.
Real Assets
Real asset categories generally delivered positive returns in May while underperforming broader equities. Global REITs rose 2.5%, led by European REITs (+4.1%) and U.K. REITs (+4.4%), which benefitted from declining bond yields and, in the case of the U.K., another BOE rate cut. Within U.S. REITs (+2.0%), lodging (+7.6%), office (+6.1%), data centers (+5.0%), and industrial (+4.7%) were the top performing sectors, while the telecom (−4.8%) healthcare (−1.4%), and residential (−0.3%) sectors saw pullbacks. Global infrastructure gained 4.4%. An emphasis on energy security has spurred significant investments in the sector. Global clean energy was up 7.8%, partly due to temporarily improved relations between the U.S. and China. Clean energy markets largely withstood proposed cuts to incentives from the Inflation
Reduction Act, as increased power demand continues to make headlines, with solar among the cheapest solutions and quickest to bring online.
WTI crude prices were up 4.4% as conflicts intensified in Ukraine and Gaza. An improved economic outlook for China also put upward pressure on prices. Meanwhile, OPEC+ agreed to increase production, but at a lower output than markets had anticipated. Natural gas prices jumped 10.5%, largely due to warmer-than-expected temperatures, which increased demand as the summer cooling season began.
Commodities (−0.6%) delivered mixed results, with the agriculture and precious metals subindexes down 3.3% and 0.3%, respectively, while industrial metals (+1.2%) and livestock (+3.4%) both experienced gains. Energy futures saw a modest rise of 0.5%. North American natural resources equities (+2.3%) benefitted from higher commodity prices. Global metals and mining equities rose +2.2% as China maintained its April export restrictions to the U.S. on seven critical minerals used in the defense, energy, and automotive sectors. MLPs gained 1.7% on increased liquified natural gas demand. The price of gold dropped by 0.5%, but is up 25.1% YTD. ⬛
Indices referenced are unmanaged and cannot be invested in directly. Index returns do not reflect any investment management fees or transaction expenses. Copyright MSCI 2025. Unpublished. All Rights Reserved. This information may only be used for your internal use, may not be reproduced or redisseminated in any form and may not be used to create any financial instruments or products or any indices. This information is provided on an “as is” basis and the user of this information assumes the entire risk of any use it may make or permit to be made of this information. Neither MSCI, any of its affiliates or any other person involved in or related to compiling, computing or creating this information makes any express or implied warranties or representations with respect to such information or the results to be obtained by the use thereof, and MSCI, its affiliates and ech such other person hereby expressly disclaim all warranties (including, without limitation, all warranties of originality, accuracy, completeness, timeliness, non-infringement, merchantability and fitness for a particular purpose) with respect to this information. Without limiting any of the foregoing, in no event shall MSCI, any of its affiliates or any other person involved in or related to compiling, computing or creating this information have any liability for any direct, indirect, special, incidental, punitive, consequential or any other damages (including, without limitation, lost profits) even if notified of, or if it might otherwise have anticipated, the possibility of such damages. Bloomberg Index Services Limited. BLOOMBERG® is a trademark and service mark of Bloomberg Finance L.P. and its affiliates (collectively “Bloomberg”). Bloomberg or Bloomberg’s licensors own all proprietary rights in the Bloomberg Indices. Bloomberg does not approve or endorse this material, or guarantee the accuracy or completeness of any information herein, or make any warranty, express or implied, as to the results to be obtained therefrom and, to the maximum extent allowed by law, it shall not have any liability or responsibility for injury or damages arising in connection therewith. Copyright ©2025, S&P Global Market Intelligence (and its affiliates, as applicable). Reproduction of any information, data or material, including ratings (“Content”) in any form is prohibited except with the prior written permission of the relevant party. Such party, its affiliates and suppliers (“Content Providers”) do not guarantee the accuracy, adequacy, completeness, timeliness or availability of any Content and are not responsible for any errors or omissions (negligent or otherwise), regardless of the cause, or for the results obtained from the use of such Content. In no event shall Content Providers be liable for any damages, costs, expenses, legal fees, or losses (including lost income or lost profit and opportunity costs) in connection with any use of the Content. A reference to a particular investment or security, a rating or any observation concerning an investment that is part of the Content is not a recommendation to buy, sell or hold such investment or security, does not address the suitability of an investment or security and should not be relied on as investment advice. Credit ratings are statements of opinions and are not statements of fact. FTSE International Limited (“FTSE”) © FTSE 2025. FTSE® is a trade mark of the London Stock Exchange Group companies and is used by FTSE under license. All rights in the FTSE indices and / or FTSE ratings vest in FTSE and/or its licensors. Neither FTSE nor its licensors accept any liability for any errors or omissions in the FTSE indices and / or FTSE ratings or underlying data. No further distribution of FTSE Data is permitted without FTSE’s express written consent. Indices referenced are unmanaged and cannot be invested in directly. All commentary contained within is the opinion of Prime Buchholz and is intended for informational purposes only; it does not constitute an offer, nor does it invite anyone to make an offer, to buy or sell securities. The content of this report is current as of the date indicated and is subject to change without notice. It does not take into account the specific investment objectives, financial situations, or needs of individual or institutional investors. Some statements in this report that are not historical facts are forward-looking statements based on current expectations of future events and are subject to risks and uncertainties that could cause actual results to differ materially from those expressed or implied by such statements. Information obtained from third-party sources is believed to be reliable; however, the accuracy of the data is not guaranteed and may not have been independently verified. Performance returns are provided by third-party data sources. Past performance is not an indication of future results. Prime Buchholz LLC© 2025