Robert Kizik, CFA, CAIA
Principal/Sr. Director, Research - Fixed Income
On April 2, 2025—declared “Liberation Day” by President Trump—the administration unveiled a sweeping new reciprocal tariff policy. The policy goes significantly beyond the existing tariffs targeting steel, aluminum, and other select imports. Under the new framework, even countries with which the U.S. runs a trade surplus will be subject to a baseline tariff of 10%.
In this Investment Perspective, we review the administration’s announcement, explore historical parallels, and assess the potential economic ramifications of this broader trade policy shift.
Tariff Announcements
A central feature of the new policy is the imposition of a uniform 10% baseline tariff on all imports—regardless of whether a country has a trade deficit or surplus with the United States—that will take effect on April 5, 2025.
Beyond the baseline, reciprocal tariffs will be imposed on a country-specific basis. For example, China will face a reciprocal tariff of 34% in addition to the 20% that was previously levied. Meanwhile, the EU, Japan, and South Korea will face tariffs of 20–25%, respectively, while Taiwan will face a 32% tariff.
These rates attempt to capture the actual duty charged by these countries as well as “non-tariff barriers” (NTBs) such as currency manipulation, quotas, subsidies to domestic producers, regulatory red tape, and others. President Trump referred to the tariffs—set to begin on April 9th—as “kind” because they are less than the combination of duties and NTBs the U.S. faces.
The formula used by the Treasury Department to account for both stated tariffs and NTBs is:

For example, China runs a $295 billion trade surplus with the U.S. on total exports of $438 billion—representing a 68% surplus-to-export ratio. Halving that figure yields the 34% reciprocal tariff now applied to Chinese imports.
The administration’s assertion that other countries will pay these tariffs is misleading. In practice, tariffs are collected by customs agents at the port of entry after the goods clear customs. The levies are then deposited into the Treasury Department’s general fund. The importer is responsible for paying the levy after the shipment has cleared customs.
Historically, tariffs have led to margin pressure for companies and higher prices for consumers. Goldman Sachs estimated the tariffs will raise the current import-weighted tariff of 2.5% to 18.8% or 12.6% when exempt goods are excluded. However, Treasury Secretary Scott Bessent indicated these rates are ceilings unless there is retaliation, which could lead to escalation, but he also alluded to the tariffs possibly being negotiated down.
At this level, the tariffs are on par with—and may exceed—the Smoot-Hawley Tariff Act of 1930. Critics have referred to the tariffs as an unprecedented tax hike on the economy.
Economic Impact
The administration has outlined three primary objectives for the new tariffs:
- Generate tax revenue to help reduce the federal budget deficit and fund an extension of the Tax Cuts and Jobs Act of 2017.
- Revitalize domestic manufacturing, with the aim of ushering in a so-called “Golden Age” for the U.S. economy.
- Advance foreign policy objectives by applying economic pressure on key trading partners.
Essentially, the administration is attempting to usher in a new age of mercantilism in the United States. While the intent is to promote national economic interests, history shows that protectionism can come at a cost, including disruption to global supply chains, increased input costs for domestic producers, and retaliatory measures from trade partners—all of which have the potential to create economic headwinds.
We note several key projections that highlight the potential risks of the current tariff approach:
- Oxford Economics estimated the 2018–19 trade war cost the U.S. approximately 245,000 jobs.
- The Congressional Budget Office projected a 10% universal tariff could cut real GDP by 0.3% by 2034 and increase the Personal Consumption Expenditures (PCE) Price by 1.0% by 2026.
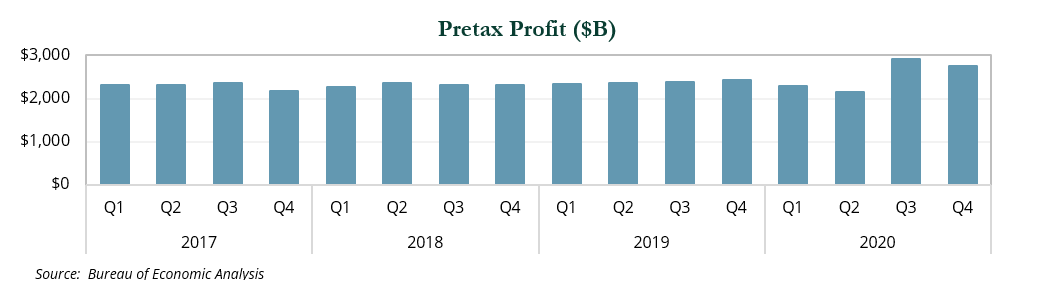
The economic impact this time around could be more severe. According to data from the Commerce Department, business earnings stagnated during Trump’s first administration. This was in part due to trade uncertainty, which can impact business planning (expansion, hiring, etc.), especially if margins get squeezed.
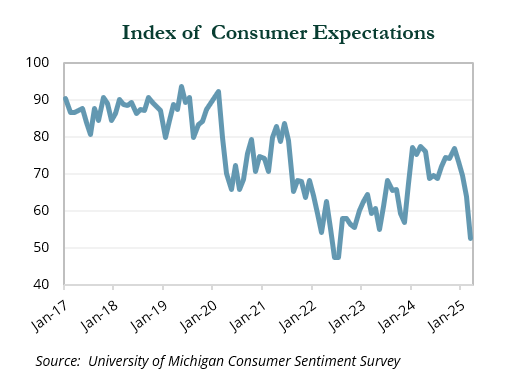
Key indicators are already showing signs of strain among consumers. Recent data from The Conference Board’s Consumer Confidence Index and the University of Michigan Consumer Sentiment Survey show steep declines in consumer attitudes due to uncertainty regarding inflation and employment, which the tariffs could exacerbate.
The actual impact on the U.S. economy is unclear. Market pundits have been reducing GDP forecasts and increasing inflation projections while several strategists and economists have increased the odds of a recession to roughly 40%.
Federal Reserve Response
During his first term, President Trump began imposing tariffs in early 2018. Recently published raw transcripts from the FOMC meetings in 2019 revealed concern among several members regarding trade policy. Discussions ranged from a demand shock, pauses in business and consumer spending plans, unemployment, and other factors. More recent statements from the Fed highlight the economic uncertainty; the word “transitory” re-entered the Fed lexicon in the press conference following the March 2024 FOMC meeting.
Any inflationary impulse from the tariffs may ultimately take a back seat to their potential drag on growth and employment. While the most recent Summary of Economic Projections includes two rate cuts in 2025, an unexpected growth shock stemming from trade disruptions could compel the Federal Reserve to pursue a more aggressive easing cycle.
Conclusion
The administration has previously backed away from imposing tariffs on close trading partners, and it’s possible that reciprocal tariffs are being used primarily as a negotiating tool rather than a long-term policy shift. However, sentiment across the board is deteriorating. The key economic risk is that “soft data” from surveys starts to impact “hard data” like GDP, CPI, and labor reports.
Risk assets have responded sharply to the announcement:
- The S&P 500 and Nasdaq dropped 4.8% and 6.0%, respectively, the day after reciprocal tariffs were announced. Investors sought safety in defensive sectors.
- Small cap stocks (as measured by the Russell 2000) fell 6.6% and became the first major U.S. stock measure to enter bear market territory.
- The U.S. dollar (as measured by the Bloomberg Dollar Spot Index) dropped over 2% during trading on April 3rd—the largest intraday decline since it was launched in 2005.
- The Nikkei 225 declined 2.8%, while Europe’s Stoxx 600 fell 2.6%. The MSCI EAFE and MSCI EM indices (priced in USD) closed the day down roughly 2%.
- High yield credit spreads widened 50 bps, causing the sector to fall 0.9%.
On the other hand, Treasury yields rallied as investors sought the safety of government bonds.
Markets increasingly expect the Fed will view tariffs as a one-time hit to inflation and will support the economy with more rate cuts.
Other areas of a diversified portfolio held up during the selloff including investment-grade corporates, global REITS and TIPS.
Additionally, hedge funds generally fared better than the broad market. Net exposures started to decline sharply ahead of the tariff announcements.
In periods of acute uncertainty, risk aversion tends to spike and investors seek shelter. While volatility is uncomfortable, it is important to remain focused on long-term investment objectives and consider periods of weakness as potential opportunities. We are ready to help clients during this rapidly evolving environment. ⬛
Indices referenced are unmanaged and cannot be invested in directly. Index returns do not reflect any investment management fees or transaction expenses. All commentary contained within is the opinion of Prime Buchholz and is intended for informational purposes only; it does not constitute an offer, nor does it invite anyone to make an offer, to buy or sell securities. The content of this report is current as of the date indicated and is subject to change without notice. It does not take into account the specific investment objectives, financial situations, or needs of individual or institutional investors. Copyright MSCI 2025. Unpublished. All Rights Reserved. This information may only be used for your internal use, may not be reproduced or redisseminated in any form and may not be used to create any financial instruments or products or any indices. This information is provided on an “as is” basis and the user of this information assumes the entire risk of any use it may make or permit to be made of this information. Neither MSCI, any of its affiliates or any other person involved in or related to compiling, computing or creating this information makes any express or implied warranties or representations with respect to such information or the results to be obtained by the use thereof, and MSCI, its affiliates and each such other person hereby expressly disclaim all warranties (including, without limitation, all warranties of originality, accuracy, completeness, timeliness, non-infringement, merchantability and fitness for a particular purpose) with respect to this information. Without limiting any of the foregoing, in no event shall MSCI, any of its affiliates or any other person involved in or related to compiling, computing or creating this information have any liability for any direct, indirect, special, incidental, punitive, consequential or any other damages (including, without limitation, lost profits) even if notified of, or if it might otherwise have anticipated, the possibility of such damages. Some statements in this report that are not historical facts are forward-looking statements based on current expectations of future events and are subject to risks and uncertainties that could cause actual results to differ materially from those expressed or implied by such statements. Information obtained from third-party sources is believed to be reliable; however, the accuracy of the data is not guaranteed and may not have been independently verified. Performance returns are provided by third-party data sources. Past performance is not an indication of future results. © 2025 Prime Buchholz LLC