In February, economic data surpassed expectations, leading to a reevaluation of policy rates and generally declining fixed income values. Meanwhile, persistent enthusiasm for artificial intelligence (AI) and robust corporate fundamentals drove significant gains in domestic equity markets, particularly by AI-related sectors like semi-conductors.
Non-U.S. equities also performed well, especially in Japan and China, despite uncertainty related to the sustainability of the Chinese government’s intervention into markets.
In fixed income, revised rate cut expectations and stronger economic indicators led to higher Treasury yields and mixed results across various sectors. There were mixed results for real assets, with divergences across global real estate investment trusts (REITs), but gains in energy-related sectors. Overall, while equities saw growth, fixed income and real assets showed mixed performances amid shifting economic conditions.
Global Equities
Domestic equity markets posted their fourth consecutive month of positive performance. The Russell 3000 Index gained 5.4%, while the S&P 500 increased 5.3% and hit the 5,000 milestone for the first time, closing the month at 5,096.
Momentum was the key driver of performance. AI continued to be the most important market theme, with semiconductor stocks gaining 17.1%. AI pure-play NVIDIA was the largest individual contributor to the S&P 500, gaining 28.6% after a strong earnings report. Year-to-date, NVIDIA has added over $700 billion in market cap, leapfrogging Amazon and Alphabet to become the third largest stock by market cap, behind only Microsoft and Apple.
Corporate fundamentals remained solid, with the S&P 500 projected to grow earnings 10.9% in 2024. However, recent market gains were primarily driven by multiple expansion, with the forward P/E ticking up from 17.3x at the end of October to 20.5x at the end of February. For reference, the 10-year average multiple for the S&P 500 was 17.7x at month-end.
Equities abroad were also strong, with developed non-U.S. and emerging markets gaining 1.8% and 4.8%, respectively. While many countries in Europe grew, most notably Italy (+5.8%), returns were generally stronger in Asia. Japan (+3.0%) continued its momentum as the Nikkei set a new all-time high during the month. Hong Kong rose 4.6% due in large part to its economic connections to China (+8.4%).
China rallied sharply after the government intervened with several support measures aimed at restoring confidence and stabilizing markets. Authorities ordered its state-backed financial services companies, including the investment arm of the country’s sovereign wealth fund, Central Huijin, to increase purchases of ETFs tracking the mainland benchmarks. China’s Securities Regulatory Commission also announced restrictions on short-selling and a ban on net selling during both market openings and closes in an effort to ease pressure from quantitative traders. Despite these efforts, sentiment toward China remained weak and it is unclear if the positive momentum is sustainable. Elsewhere in Asia, Korea advanced 7.4% in anticipation of measures seeking to boost stock valuations via corporate governance improvements and tax incentives.
Fixed Income
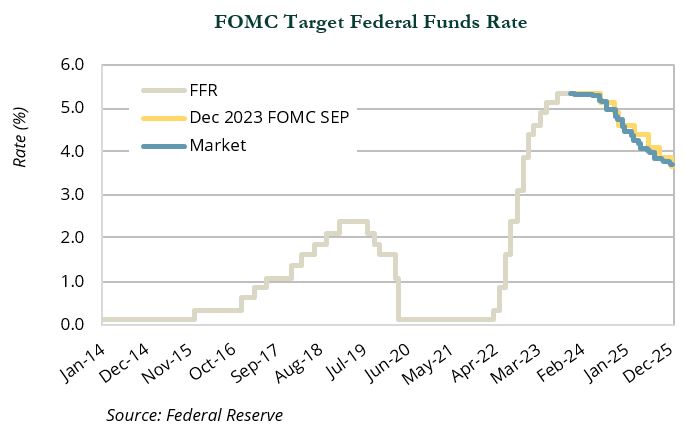
Expectations for rate cuts in 2024 lessened in February due to multiple strong economic reports—from upside surprises in Q4 2023 GDP to a strong labor market and above-consensus inflation expectations—and several Fed speakers who reinforced the idea of patience amongst the Federal Open Market Committee (FOMC). The chart below compares pricing in futures markets with the most recently available FOMC guidance and shows that market expectations regarding the path of the policy rates were aligned with Fed guidance.
Treasury yields rose as investors reassessed the initiation and pace of rate cuts. The most significant increases occurred in 2- and 5-year Treasuries, which rose 41 bps and 38 bps, respectively. The 10-year and 30-year Treasuries also grew 29 bps and 17 bps, respectively. Given the impact of duration, performance steadily worsened moving further out on the yield curve. Treasury bills rose 0.4% and it outperformed 1-3 year Treasuries (−0.4%), 5-10 year Treasuries (−1.8%), and long-term Treasuries (−2.3%). In aggregate, Treasuries fell 1.3%. Within spread sectors, high yield corporates and commercial mortgage-backed securities (MBS) both experienced spread tightening, but investment-grade corporates, agency MBS, and asset-backed securities (ABS) saw spreads hold steady. The impact of rising rates led to declines in investment-grade corporates (−1.5%), commercial MBS (−0.8%), MBS (−1.6%), and ABS (−0.3%). High yield (+0.3%) and leveraged loans (+1.1%) were the only areas of fixed income to deliver positive returns during the month.
Real Assets
Real assets delivered mixed results in February. U.S. REITs rose 1.7%, while European and U.K. REITs declined 8.1% and 7.2%, respectively, dragging down global REIT (-0.6%) performance. Within the U.S., office (−2.0%) and other rate-sensitive sectors underperformed, while regional malls outperformed (+7.8%). Regional malls are up 31.0% over the trailing one-year period, falling behind only data centers, which have increased 36.0% over the same period.
There continues to be a flood of commercial real estate headlines, mostly related to office defaults, with San Francisco vacancy rates eclipsing 30%. Additionally, select regional banks, including New York Community Bancorp, experienced further stress due to their office and rent-controlled apartment exposures. While there is some concern that a larger cohort of regional banks may become stressed, Michael Barr, Federal Reserve Vice Chair for Supervision, appeared to downplay those concerns and recently noted, “for a small number of banks with a risk profile that could result in funding pressures, supervisors are continuously monitoring these firms.” Commercial MBS delinquency rates have increased from the prior year, with the increase driven almost entirely by the office sector.
Natural resource equities (+2.6%) were positive in February on increased prices in Brent Crude (+1.7%), as well as strong earnings and continued distributions.
MLPs (+4.3%) had another month of positive performance, as the sector continues to demonstrate strong market fundamentals and offer attractive yields. Commodities decreased 1.5%, primarily due to weakened investor sentiment concerning economic growth in China. Global infrastructure (+0.0%) and clean energy (−0.1%) saw little change on the month. ⬛
Indices referenced are unmanaged and cannot be invested in directly. Index returns do not reflect any investment management fees or transaction expenses. Copyright MSCI 2024. Unpublished. All Rights Reserved. This information may only be used for your internal use, may not be reproduced or redisseminated in any form and may not be used to create any financial instruments or products or any indices. This information is provided on an “as is” basis and the user of this information assumes the entire risk of any use it may make or permit to be made of this information. Neither MSCI, any of its affiliates or any other person involved in or related to compiling, computing or creating this information makes any express or implied warranties or representations with respect to such information or the results to be obtained by the use thereof, and MSCI, its affiliates and each such other person hereby expressly disclaim all warranties (including, without limitation, all warranties of originality, accuracy, completeness, timeliness, non-infringement, merchantability and fitness for a particular purpose) with respect to this information. Without limiting any of the foregoing, in no event shall MSCI, any of its affiliates or any other person involved in or related to compiling, computing or creating this information have any liability for any direct, indirect, special, incidental, punitive, consequential or any other damages (including, without limitation, lost profits) even if notified of, or if it might otherwise have anticipated, the possibility of such damages. Bloomberg Index Services Limited. BLOOMBERG® is a trademark and service mark of Bloomberg Finance L.P. and its affiliates (collectively “Bloomberg”). Bloomberg or Bloomberg’s licensors own all proprietary rights in the Bloomberg Indices. Bloomberg does not approve or endorse this material, or guarantee the accuracy or completeness of any information herein, or make any warranty, express or implied, as to the results to be obtained therefrom and, to the maximum extent allowed by law, it shall not have any liability or responsibility for injury or damages arising in connection therewith. Copyright ©2024, S&P Global Market Intelligence (and its affiliates, as applicable). Reproduction of any information, data or material, including ratings (“Content”) in any form is prohibited except with the prior written permission of the relevant party. Such party, its affiliates and suppliers (“Content Providers”) do not guarantee the accuracy, adequacy, completeness, timeliness or availability of any Content and are not responsible for any errors or omissions (negligent or otherwise), regardless of the cause, or for the results obtained from the use of such Content. In no event shall Content Providers be liable for any damages, costs, expenses, legal fees, or losses (including lost income or lost profit and opportunity costs) in connection with any use of the Content. A reference to a particular investment or security, a rating or any observation concerning an investment that is part of the Content is not a recommendation to buy, sell or hold such investment or security, does not address the suitability of an investment or security and should not be relied on as investment advice. Credit ratings are statements of opinions and are not statements of fact. FTSE International Limited (“FTSE”) © FTSE 2024. FTSE® is a trade mark of the London Stock Exchange Group companies and Is used by FTSE under license. All rights in the FTSE indices and / or FTSE ratings vest in FTSE and/or its licensors. Neither FTSE nor its licensors accept any liability for any errors or omissions In the FTSE indices and / or FTSE ratings or underlying data. No further distribution of FTSE Data is permitted without FTSE’s express written consent. Indices referenced are unmanaged and cannot be invested in directly. Index returns do not All commentary contained within is the opinion of Prime Buchholz and is intended for informational purposes only; it does not constitute an offer, nor does it invite anyone to make an offer, to buy or sell securities. The content of this report is current as of the date indicated and is subject to change without notice. It does not take into account the specific investment objectives, financial situations, or needs of individual or institutional investors. Some statements in this report that are not historical facts are forward-looking statements based on current expectations of future events and are subject to risks and uncertainties that could cause actual results to differ materially from those expressed or implied by such statements. Information obtained from third-party sources is believed to be reliable; however, the accuracy of the data is not guaranteed and may not have been independently verified. Performance returns are provided by third-party data sources. Past performance is not an indication of future results.