 Global equity markets experienced sustained positive momentum in January, with domestic equity markets posting gains and the S&P 500 achieving all-time highs. However, concerns about increased market volatility and cautious Federal Reserve indications regarding delayed interest rate cuts could temper investor sentiment.
Globally, Japan’s equity market stood out, driven by an improving economy and supportive monetary policy, while emerging markets (EM) faced headwinds, particularly in China due to policy uncertainties and financial market challenges.
In fixed income, the yield curve steepened, reflecting diverging expectations for short and long-term interest rates, amidst a backdrop of mixed corporate credit spreads and significant leveraged loan issuance, pointing to a nuanced and evolving investment environment.
Equities
Domestic equity markets posted their third consecutive month of positive performance. The S&P 500 gained 1.7%, while the broader Russell 3000 Index rose 1.1%. The S&P 500 hit all-time highs, surpassing the prior all-time high registered in January 2022. Historically, setting a new all-time high after more than a year without one has been considered a bullish signal. Carson Group’s data shows that 92% of the time, the S&P posted gains over the next 12 months; on average, the index recorded a 13.3% return.
However, indicators suggest that markets may face more volatility in the months ahead. Recent market advances were driven by tech/tech-related stocks, with just three names (NVIDIA, Microsoft, and Meta) accounting for over 80% of gains in January. Further, indications from the Fed that interest rate cuts might occur later than anticipated could dampen investor enthusiasm. Finally, with the recent market move, the S&P 500 traded at 19.8x forward earnings at month-end versus the 10-year average of 17.6x.
Strength in the U.S. dollar (USD) masked what was a positive start to the year for developed non-U.S. equities. The MSCI EAFE Index rose 2.6% in local terms, but just 0.6% in USD. Japan (+4.6% USD) continued its momentum, as the Nikkei hit its highest level since 1990. Foreign investors flocked to the Japanese market on the prospect of a strengthening domestic economy, improving corporate governance, and supportive monetary policy.
While a 3.6% decline in the yen weighed on returns, it boosted Japan’s robust export sector. Returns across Europe varied widely. Though up just 0.1% in USD terms, the French market posted an all-time high. Conversely, Portugal’s market declined 8.7% amidst political uncertainty and weak demand from abroad.
Emerging markets equities (−4.6%) struggled to start the year. China (−10.6%) sold off sharply due to mounting investor frustrations with the government’s policy to support its ailing economy and financial markets. Also, Hong Kong officials ordered the liquidation of troubled property developer, China Evergrande, after it failed to reach a restructure agreement with creditors on over $300 billion in debt. While Beijing has signaled a commitment to prioritize stability in the wake of this news, the impact on financial markets remained uncertain. Through month-end, Beijing had refrained from providing a large bailout package in favor of incremental support, which has been widely viewed as underwhelming.
Elsewhere, India (+2.4%) continued its strong run, benefiting from investor aversion from China and a strong macroeconomic outlook.
Fixed Income
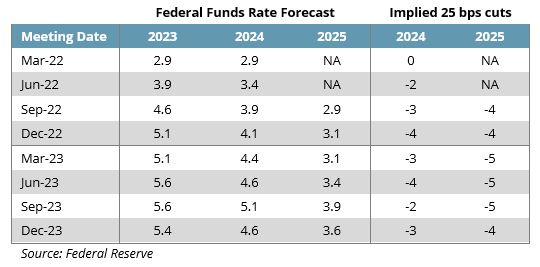
The Federal Reserve was in a quiet period for the second half of the month, ahead of its January 30/31 meeting. A popular notion in the marketplace was that the Fed pivoted at its December meeting because the Summary of Economic Projections (SEP) suggested the potential for three rate cuts in 2024, which was one more rate cut than suggested in the September 2023 SEP.
The Fed has forecasted between three and four 25 bps rate cuts since the third quarter of 2022 so while there was a slight change between the September and December 2023 forecasts, it does not necessarily “feel” like a pivot.
The yield curve steepened in January with the front-end of the curve holding relatively stable, but the long-end seeing increases. The yield on the 10-year U.S. Treasury rose 7 bps to 4.0% and there was a 16 bps increase in the 30-year Treasury, to 4.2%. As a result of changes in the shape of the curve, three-month Treasury bills (+0.4%) outperformed intermediate-term Treasuries (+0.0%) and long-term Treasuries (−2.2%) in January. In aggregate, Treasuries fell 0.3%
Corporate credit spreads were mixed. The yield on investment-grade corporates was largely unchanged, but rising Treasury yields caused the spread to contract 3 bps to 96 bps over comparable maturity Treasuries. High yield spreads rose 21 bps to 344 bps. The higher carry on high yield allowed it to deliver a flat return while investment-grade corporates fell 0.2%.
Within securitized sectors, the spread on both commercial mortgage-backed securities (CMBS) and asset-backed securities (ABS) fell 13 bps and 11 bps, respectively. This helped CMBS rise 0.7% in January, outperforming the 0.5% return of ABS and the 0.5% decline of agency mortgage-backed securities (MBS). Rising yields at the long-end of the curve caused MBS to sell-off.
Elsewhere in credit markets, January witnessed the largest ever single-month issuance of leveraged loans in the United States. Borrowers seized the moment after credit spreads tightened sharply in the fourth quarter, issuing roughly $140 billion in loans—nearly double the previous record of $75 billion in November 2021. Interestingly, the vast majority of the issuance consisted of refinancing and repricing of existing loans as M&A activity remained muted, minimizing the need for new debt.
Real Assets
Real assets were down broadly in January. Global real estate declined 4.0% with U.S. REITs (−4.1%) and European REITs (−4.5%) underperforming the broader index as both central banks announced plans to hold rates steady in the near-term. After being the only real estate sector to see gains in January, data centers (+3.0%) continued to see exceptional tailwinds driven by higher global data consumption and the growth of AI.
Telecom (−8.8%), comprising mainly cell towers, was the worst performing real estate sector and remains sensitive to interest rates in the short term. Revised rate expectations drove global infrastructure (−3.1%) lower.
Natural resource equities declined modestly (−1.9%), despite both a 4.6% increase in the price of Brent crude oil and continued strong earnings from leading energy producers. Natural gas prices (−18.6%) slid in January as the Biden administration suspended the approval process for new liquefied natural gas export terminals. Commodities (−0.9%) were mixed while industrial metals (−1.9%) fell on ongoing concerns about the Chinese economy.
MLPs (+4.4%) delivered another strong month of performance, bring the trailing one-year return to 23.9%, due to resilient fundamentals and highly attractive yields. Global clean energy (−10.9%) started the year poorly and fell 20.7% in 2023. In the short term, the sector remains sensitive to interest rate expectations and some firms are still working through poorly structured deals signed in a lower rate environment. Despite recent headwinds and poor performance, medium- and long-term tailwinds for the sector remain intact. ⬛
Indices referenced are unmanaged and cannot be invested in directly. Index returns do not reflect any investment management fees or transaction expenses. Copyright MSCI 2024. Unpublished. All Rights Reserved. This information may only be used for your internal use, may not be reproduced or redisseminated in any form and may not be used to create any financial instruments or products or any indices. This information is provided on an “as is” basis and the user of this information assumes the entire risk of any use it may make or permit to be made of this information. Neither MSCI, any of its affiliates or any other person involved in or related to compiling, computing or creating this information makes any express or implied warranties or representations with respect to such information or the results to be obtained by the use thereof, and MSCI, its affiliates and each such other person hereby expressly disclaim all warranties (including, without limitation, all warranties of originality, accuracy, completeness, timeliness, non-infringement, merchantability and fitness for a particular purpose) with respect to this information. Without limiting any of the foregoing, in no event shall MSCI, any of its affiliates or any other person involved in or related to compiling, computing or creating this information have any liability for any direct, indirect, special, incidental, punitive, consequential or any other damages (including, without limitation, lost profits) even if notified of, or if it might otherwise have anticipated, the possibility of such damages. Bloomberg Index Services Limited. BLOOMBERG® is a trademark and service mark of Bloomberg Finance L.P. and its affiliates (collectively “Bloomberg”). Bloomberg or Bloomberg’s licensors own all proprietary rights in the Bloomberg Indices. Bloomberg does not approve or endorse this material, or guarantee the accuracy or completeness of any information herein, or make any warranty, express or implied, as to the results to be obtained therefrom and, to the maximum extent allowed by law, it shall not have any liability or responsibility for injury or damages arising in connection therewith. Copyright ©2024, S&P Global Market Intelligence (and its affiliates, as applicable). Reproduction of any information, data or material, including ratings (“Content”) in any form is prohibited except with the prior written permission of the relevant party. Such party, its affiliates and suppliers (“Content Providers”) do not guarantee the accuracy, adequacy, completeness, timeliness or availability of any Content and are not responsible for any errors or omissions (negligent or otherwise), regardless of the cause, or for the results obtained from the use of such Content. In no event shall Content Providers be liable for any damages, costs, expenses, legal fees, or losses (including lost income or lost profit and opportunity costs) in connection with any use of the Content. A reference to a particular investment or security, a rating or any observation concerning an investment that is part of the Content is not a recommendation to buy, sell or hold such investment or security, does not address the suitability of an investment or security and should not be relied on as investment advice. Credit ratings are statements of opinions and are not statements of fact. FTSE International Limited (“FTSE”) © FTSE 2024. FTSE® is a trade mark of the London Stock Exchange Group companies and Is used by FTSE under license. All rights in the FTSE indices and / or FTSE ratings vest in FTSE and/or its licensors. Neither FTSE nor its licensors accept any liability for any errors or omissions In the FTSE indices and / or FTSE ratings or underlying data. No further distribution of FTSE Data is permitted without FTSE’s express written consent. Indices referenced are unmanaged and cannot be invested in directly. Index returns do not All commentary contained within is the opinion of Prime Buchholz and is intended for informational purposes only; it does not constitute an offer, nor does it invite anyone to make an offer, to buy or sell securities. The content of this report is current as of the date indicated and is subject to change without notice. It does not take into account the specific investment objectives, financial situations, or needs of individual or institutional investors. Some statements in this report that are not historical facts are forward-looking statements based on current expectations of future events and are subject to risks and uncertainties that could cause actual results to differ materially from those expressed or implied by such statements. Information obtained from third-party sources is believed to be reliable; however, the accuracy of the data is not guaranteed and may not have been independently verified. Performance returns are provided by third-party data sources. Past performance is not an indication of future results.