Global financial markets in 2023 were defined by volatility as investors navigated the effects of inflation, geopolitical tensions, policy decisions, post-pandemic consumer trends, and the utter domination of the “Magnificent Seven” stocks. Many believed that the U.S. economy would enter a recession in 2023 but the consumer proved to be resilient and government spending on infrastructure supported growth.
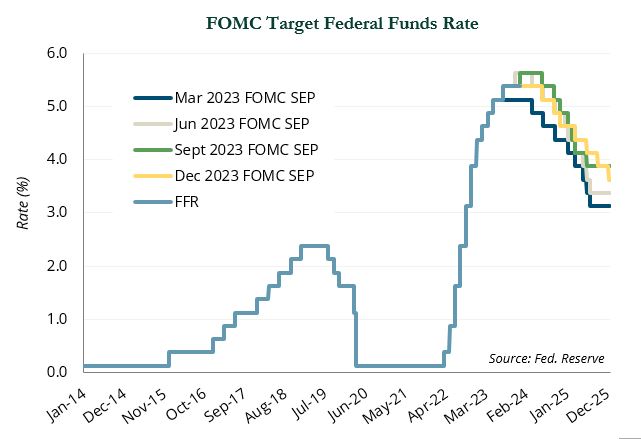
Inflation dynamics and Federal Reserve policy were two critical factors underlying market activity during the year. The Fed maintained a hawkish stance throughout the year in reaction to elevated inflation. However, the pace of rate hikes slowed from six 50-75 bps hikes in 2022 to four 25 bps hikes in 2023. Due to the lagging nature of monetary policy, the impact on inflation was not immediate but ultimately accomplished the goal of moderating inflation. The November 2023 CPI report showed that headline inflation moderated from 6.5% to 3.1% and core inflation fell from 5.7% to 4.0% on a year-over-year basis.
While the Fed reserved the right to hike further if necessary, the tightening cycle effectively ended in July. Markets then turned their attention to how quickly an easing cycle would commence.
Beyond inflation, numerous major geopolitical events impacted markets in 2023, including the ongoing war between Russia and Ukraine, hostilities in Gaza and Israel following the October attack by Hamas, the concerning dynamics of China’s real estate market, and the ongoing dysfunction of U.S. politics that threatened the country’s first ever default. Markets shrugged off these risks and risk assets delivered strong performance.
U.S. Equities
The S&P 500 gained 26.3% in 2023, exiting the bear market and falling just short of all-time highs registered in early 2022; the broader Russell 3000 Index gained 26.0%. From a sector and style perspective, 2023 was the polar opposite of 2022.
With inflation subsiding and investors pricing in rate cuts, growth stocks outpaced their value counterparts by almost 3,000 bps after trailing by roughly 2,100 bps in 2022. After finishing 2022 as the only sectors in positive territory, utilities (−7.0%) and energy (−0.2%) were the only negative sectors in 2023.
Tech-related stocks, which sold off in 2022, rebounded sharply in 2023. IT (+59.3%) was the best performing sector, with AI pure-play NVIDIA posting an eye-popping 239.0% gain.
Communications services (+53.6%) and consumer discretionary (+40.7%) followed behind, with the tailwind of outsized gains from Meta Platforms (+194.1%) and Tesla (+101.7%). In total, the “Magnificent Seven” mega cap tech stocks accounted for roughly 54% of the Russell 3000 gains for the calendar year.
Global Equities
Developed non-U.S. equities gained a better than expected 18.2% in 2023. Entering the year, the prospects for Europe were particularly dim amidst fears of a potential energy crisis and recession. Mild winter temperatures helped alleviate the energy concerns, and while an official recession was not called in 2023, there is a pervasive sentiment that Europe is in the midst of a mild recession.
European equities rallied more than 11% in the first quarter but stalled in the summer and fall as the European Central Bank hiked rates to an all-time high in September.
Japan was one of the best performing markets, up 28.6% in local terms (+20.3% USD). The Japanese equity market arose from a long hibernation as a result of marked improvements in corporate governance, a Warren Buffet-led reversal in investor sentiment, and the welcome return of inflation.
Emerging markets equities (+9.7%) trailed developed market counterparts as China (−11.2%) loomed over the asset class. Sentiment toward China hit historic lows as incremental policy support from Beijing aimed at stabilizing the country’s troubled property sector and fragile economic recovery failed to reignite investor confidence. Most other major emerging markets posted double-digit gains.
Latin America was a standout on the back of Mexico (+40.9%) and Brazil (+32.7%), which surprised markets to the upside. While rising energy prices provided a tailwind to the commodity-rich economy, Brazil also benefited from tax reform progress and monetary policy action. Brazil’s Bovespa Index hit a record high in December after the country’s central bank announced a 50 bps rate cut and signaled additional cuts in 2024. Markets also reacted favorably to long-awaited tax reform that has historically impeded multi-national companies from doing business in the country. India (+20.8%) continued a multi-year run of strong performance as investors remained bullish on the country’s relative economic momentum, domestic demand growth, and political stability.
Private Equity
Private equity deal value, after reaching peak levels in 2021, declined by nearly 70% through the third quarter of 2023 due to high inflation and interest rates. Preliminary data shows deal value is expected to end 2023 at just one-third of 2021’s record activity. Facing tight financing conditions, sponsors shifted their focus toward more add-on acquisitions and take-private deals, with the latter making up half of the top 10 largest deals of the year.
Exit activity slowed dramatically in 2023, with exit value down from its peak in the second quarter of 2021, according to Pitchbook. Liquidity challenges are emerging as more funds reach the end of fund lives, with many deals still to exit. Fundraising rebounded somewhat from 2022, but remained off the unprecedented levels of 2021. However, mega funds and middle-market funds showed resilience by significantly increasing their share of the total capital raised in 2023.
The collapse of Silicon Valley Bank in March foreshadowed financing issues that challenged sponsors in the first half of the year. However, valuations stabilized and cautious optimism emerged in the second half of the year, even as risks like high inflation persisted.
Venture capital saw substantial declines across stages and metrics. Deal value dropped more than 75% from its peak in the second quarter of 2021 to hit a six-year low in the third quarter of 2023, according to CB Insights. The number of down rounds and inside rounds also increased significantly.
Exits also hit new lows. IPO activity was muted in the first three quarters of 2023. This exit environment caused overall venture capital fundraising to drop below 2020 levels as limited partners saw reduced liquidity events.
Hedge Funds
Within the context of a 26.3% gain in the S&P 500, hedge fund performance was disappointing in 2023. Alpha in short books was impeded by the narrowness of the equity market rally. In addition, a rotation into lower quality equities over the final two months of the year was a headwind. Despite these market dynamics, many long/short equity managers were able to navigate this tough environment and generate positive alpha for the year—even if it was overshadowed by another 20%+ year for the S&P 500.
Tech- and growth-focused managers that benefited from the gains of the “Magnificent Seven”—as well as other tech companies such as ServiceNow, Uber, and Salesforce—generated strong gains during the year. Long/short managers that favored other sectors or invested down cap generally had a tough year, but results for this cohort were highly varied. Healthcare-focused managers, particularly biotech specialists, tended to be the most volatile and have the widest dispersion. Diabetes and weight loss drug makers Eli Lilly and Novo Nordisk surged while the broader biotech industry collapsed over the year’s first 10 months. However, biotech was a leading sector during the November and December rally.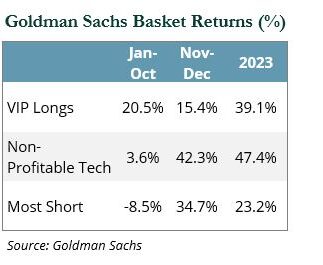
The table at left provides some context to the difficulties of the year-end rally for long/short managers; performance in the long book remained strong, but popular stocks in the short book ratcheted higher when a sharp easing of monetary policy began to be priced in by the market.
Credit and event-driven manager performance was less eventful than long/short managers; most of the managers in this group achieved high single-digit to low double-digit returns in 2023. Credit spreads compressed, which weighed on hedges, and while there was an uptick in defaults they remained low relative to history. Many credit managers performed in line with net exposures, benefiting from higher yields and prices on performing credit positions. Managers generally expect a continued uptick in defaults in 2024. Merger activity is low, but the Federal Trade Commission’s inability to block deals such as Microsoft/
Activision and Horizon/Amgen created optimism amongst arbitrageurs heading into 2024.
The lure of high yields has increased investor demand for private credit and large asset managers continued to benefit from the stable fees and illiquid nature of the asset class. This has led to aggressive fundraising in the upper middle market, with many private lenders now competing with multinational banks and public markets.
Fixed Income
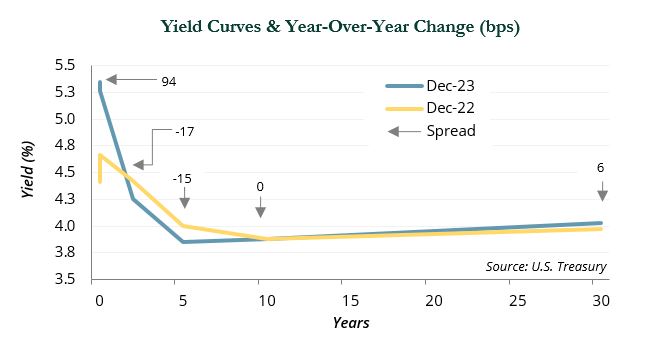
Comparing year-end 2022 to year-end 2023 would suggest stability over the course of the calendar year; however, it was not as smooth of a ride as that may imply.
The front-end of the yield reflected the rate hikes that occurred in 2023; the “belly” of the curve fell by 15–17 bps, the 10-year was flat, and the long-end rose approximately 6 bps. However, interest rate volatility remained high over the course of the year, and while Treasuries delivered positive returns overall, there were periods of weakness during 2023. By the end of the year, long-term Treasuries rose 2.7%, but lagged the 5.1% gain in Treasury bills, and the 4.0–4.2% return of short- and intermediate-term Treasuries.
Credit spread volatility was lower than interest rate volatility. During the year, high yield spreads tightened by 146 bps to 323 bps and investment-grade corporate spreads fell 131 bps to 99 bps, which led to a 13.4% gain in high yield bonds and an 8.3% increase in investment-grade bonds. With the prospect of rate hikes ending, high yield bonds slightly outperformed the 13.1% rise in floating rate loans.
Real Assets
 For most of 2023, REITs were in negative territory due to a host of factors that included rate hikes, negative sentiment toward the office and apartment sectors, and the impact that the possibility of an economic downturn that would have on demand. However, after declining 24.2% in 2022, global REITs rallied sharply in the final two months to end 2023 up 9.7% as a result of lower rates and a higher likelihood of an economic soft landing. During market shifts, REIT markets have tended to overshoot to the upside and the downside relative to private real estate (−2.2% in 2023 through September and +2.9% in 2022).
Global infrastructure stocks (+6.4%) followed a similar pattern with a strong end to the year; the sector is expected to benefit from the lagged effect of built-in inflation escalators. Despite reduced credit availability, private infrastructure posted a 6.7% return year-to-date through September, bolstered by digital, transportation, and energy infrastructure supported asset and company growth plans.
Crude oil prices were down 10.3% and ended the year at $77/barrel amidst higher production in the U.S. and weaker demand prospects from China.
Natural gas spot prices fell 28.6% on higher U.S. production, strong storage levels, and forecasts for a mild winter. Despite spot price weakness, energy companies (−1.3% for the year) remained highly profitable. Fundamentals continued to appear strong, with steadily growing demand and under-investment in future production.Private energy funds (+4.4%) benefited from robust exit markets, as public energy companies attempted to replenish depleted inventories by acquiring existing assets developed by private equity firms. Exxon’s acquisition of shale leader Pioneer headlined a series of mergers as larger players looked to secure drilling inventory. With attractive relative yields over 7.5%, MLPs (+26.6%) benefitted from increased volumes and high barriers to entry due to difficulty in building new pipelines. ⬛
Indices referenced are unmanaged and cannot be invested in directly. Index returns do not reflect any investment management fees or transaction expenses. Copyright MSCI 2023. Unpublished. All Rights Reserved. This information may only be used for your internal use, may not be reproduced or redisseminated in any form and may not be used to create any financial instruments or products or any indices. This information is provided on an “as is” basis and the user of this information assumes the entire risk of any use it may make or permit to be made of this information. Neither MSCI, any of its affiliates or any other person involved in or related to compiling, computing or creating this information makes any express or implied warranties or representations with respect to such information or the results to be obtained by the use thereof, and MSCI, its affiliates and each such other person hereby expressly disclaim all warranties (including, without limitation, all warranties of originality, accuracy, completeness, timeliness, non-infringement, merchantability and fitness for a particular purpose) with respect to this information. Without limiting any of the foregoing, in no event shall MSCI, any of its affiliates or any other person involved in or related to compiling, computing or creating this information have any liability for any direct, indirect, special, incidental, punitive, consequential or any other damages (including, without limitation, lost profits) even if notified of, or if it might otherwise have anticipated, the possibility of such damages. Bloomberg Index Services Limited. BLOOMBERG® is a trademark and service mark of Bloomberg Finance L.P. and its affiliates (collectively “Bloomberg”). Bloomberg or Bloomberg’s licensors own all proprietary rights in the Bloomberg Indices. Bloomberg does not approve or endorse this material, or guarantee the accuracy or completeness of any information herein, or make any warranty, express or implied, as to the results to be obtained therefrom and, to the maximum extent allowed by law, it shall not have any liability or responsibility for injury or damages arising in connection therewith. Copyright ©2023, S&P Global Market Intelligence (and its affiliates, as applicable). Reproduction of any information, data or material, including ratings (“Content”) in any form is prohibited except with the prior written permission of the relevant party. Such party, its affiliates and suppliers (“Content Providers”) do not guarantee the accuracy, adequacy, completeness, timeliness or availability of any Content and are not responsible for any errors or omissions (negligent or otherwise), regardless of the cause, or for the results obtained from the use of such Content. In no event shall Content Providers be liable for any damages, costs, expenses, legal fees, or losses (including lost income or lost profit and opportunity costs) in connection with any use of the Content. A reference to a particular investment or security, a rating or any observation concerning an investment that is part of the Content is not a recommendation to buy, sell or hold such investment or security, does not address the suitability of an investment or security and should not be relied on as investment advice. Credit ratings are statements of opinions and are not statements of fact. FTSE International Limited (“FTSE”) © FTSE 2023. FTSE® is a trade mark of the London Stock Exchange Group companies and Is used by FTSE under license. All rights in the FTSE indices and / or FTSE ratings vest in FTSE and/or its licensors. Neither FTSE nor its licensors accept any liability for any errors or omissions In the FTSE indices and / or FTSE ratings or underlying data. No further distribution of FTSE Data is permitted without FTSE’s express written consent. Indices referenced are unmanaged and cannot be invested in directly. Index returns do not All commentary contained within is the opinion of Prime Buchholz and is intended for informational purposes only; it does not constitute an offer, nor does it invite anyone to make an offer, to buy or sell securities. The content of this report is current as of the date indicated and is subject to change without notice. It does not take into account the specific investment objectives, financial situations, or needs of individual or institutional investors. Some statements in this report that are not historical facts are forward-looking statements based on current expectations of future events and are subject to risks and uncertainties that could cause actual results to differ materially from those expressed or implied by such statements. Information obtained from third-party sources is believed to be reliable; however, the accuracy of the data is not guaranteed and may not have been independently verified. Performance returns are provided by third-party data sources. Past performance is not an indication of future results.